import pandas as pd
import geopandas as gpd
import nltk
import string
import textblob
import seaborn as sns
import re
import contextily as cx
import matplotlib
from matplotlib import pyplot as plt
import numpy as np
import cenpy
import hvplot.pandas
import geoviews as gv
import geoviews.tile_sources as gvts
import holoviews as hv
from sklearn.linear_model import LinearRegression
from mpl_toolkits.axes_grid1 import make_axes_locatable
from holoviews import opts
from shapely.geometry import Polygon
nltk.download('stopwords')
hv.extension('bokeh', 'matplotlib');
Yelp Reviews Exploration
Xiong Zheng
1 Introduction
In this project, we'll explore restaurant review data available through the Yelp Dataset Challenge. The dataset includes Yelp data for user reviews and business information for 10 metropolitan areas.This project is broken into two parts:
Part 1: Testing how well sentiment analysis works Part 2: Analyzing correlations between restaurant reviews and census data
2 Sentiment analysis
First, Format the review text, split the review text into its individual words and make all of the words lower-cased Second, to remove any stop words from the list of words in each review. Then, Calculate polarity and subjectivity Last, Comparing the sentiment analysis to number of stars
review_clv = pd.read_json("./data/reviews_cleveland.json.gz",orient="records",lines=True)
review_clv["formatted_text"] = review_clv["text"].str.lower()
review_clv["formatted_text"] = review_clv["formatted_text"].str.findall( r'\w+|[^\s\w]+')

stop_words = list(set(nltk.corpus.stopwords.words('english')))
punctuation = list(string.punctuation)
ignored = stop_words + punctuation

review_clv["formatted_text"] = [[i for i in b if i not in ignored] for b in review_clv["formatted_text"]]
for p in punctuation:
    review_clv["formatted_text"] = [[i for i in b if not i.startswith (p)] for b in review_clv["formatted_text"]]

blobs = [textblob.TextBlob(" ".join(b)) for b in review_clv["formatted_text"]]
review_clv['polarity'] = [blob.sentiment.polarity for blob in blobs]
review_clv['subjectivity'] = [blob.sentiment.subjectivity for blob in blobs]

# instead of making two plots, a side-by-side plot is made to display the comparison
figure, axes = plt.subplots(1, 2)
figure.suptitle("Polarity & Subjectivity Plots based on Review Stars",fontsize=25)
flierprops = dict(marker='+', markerfacecolor='black', markersize=1, markeredgecolor='black')
sns.set_style("whitegrid")
sns.set(rc={'axes.facecolor':'#F0F0F1'})

boxplot1=sns.boxplot(
    y='polarity',
    x='stars',
    linewidth=1,
    data=review_clv,
    color="#5687BA",
    ax=axes[0],
    width=0.6,
    flierprops=flierprops)

boxplot2=sns.boxplot(
    y='subjectivity',
    x='stars',
    linewidth=1,
    data=review_clv,
    color="#E23446",
    ax=axes[1],
    width=0.6,
    flierprops=flierprops)

boxplot1.set_xlabel("Stars", fontsize=14)
boxplot1.set_ylabel("Polarity", fontsize=14)
boxplot2.set_xlabel("Stars", fontsize=14)
boxplot2.set_ylabel("Subjectivity", fontsize=14)
axes[0].axhline(y=0, c='k', lw=2,linestyle='--')
axes[1].axhline(y=0, c='k', lw=2,linestyle='--')

for patch in boxplot1.artists:
 r, g, b, a = patch.get_facecolor()
 patch.set_facecolor((r, g, b, .6))
for patch in boxplot2.artists:
 r, g, b, a = patch.get_facecolor()
 patch.set_facecolor((r, g, b, .6))
for line in boxplot1.get_lines():
   line.set_color('black')
for line in boxplot2.get_lines():
   line.set_color('black')

plt.rcParams["figure.figsize"] = [16,10]
plt.show()

Question: What do your charts indicate for the effectiveness of our sentiment analysis? Answer: The polarities rise as stars go up, however the subjectivities rise relatively slowly. This indicates the sentiment analysis is not accurate. Because polarities should corresponde with subjectivities, rising at the similar speed.
2.1 The importance of individual words
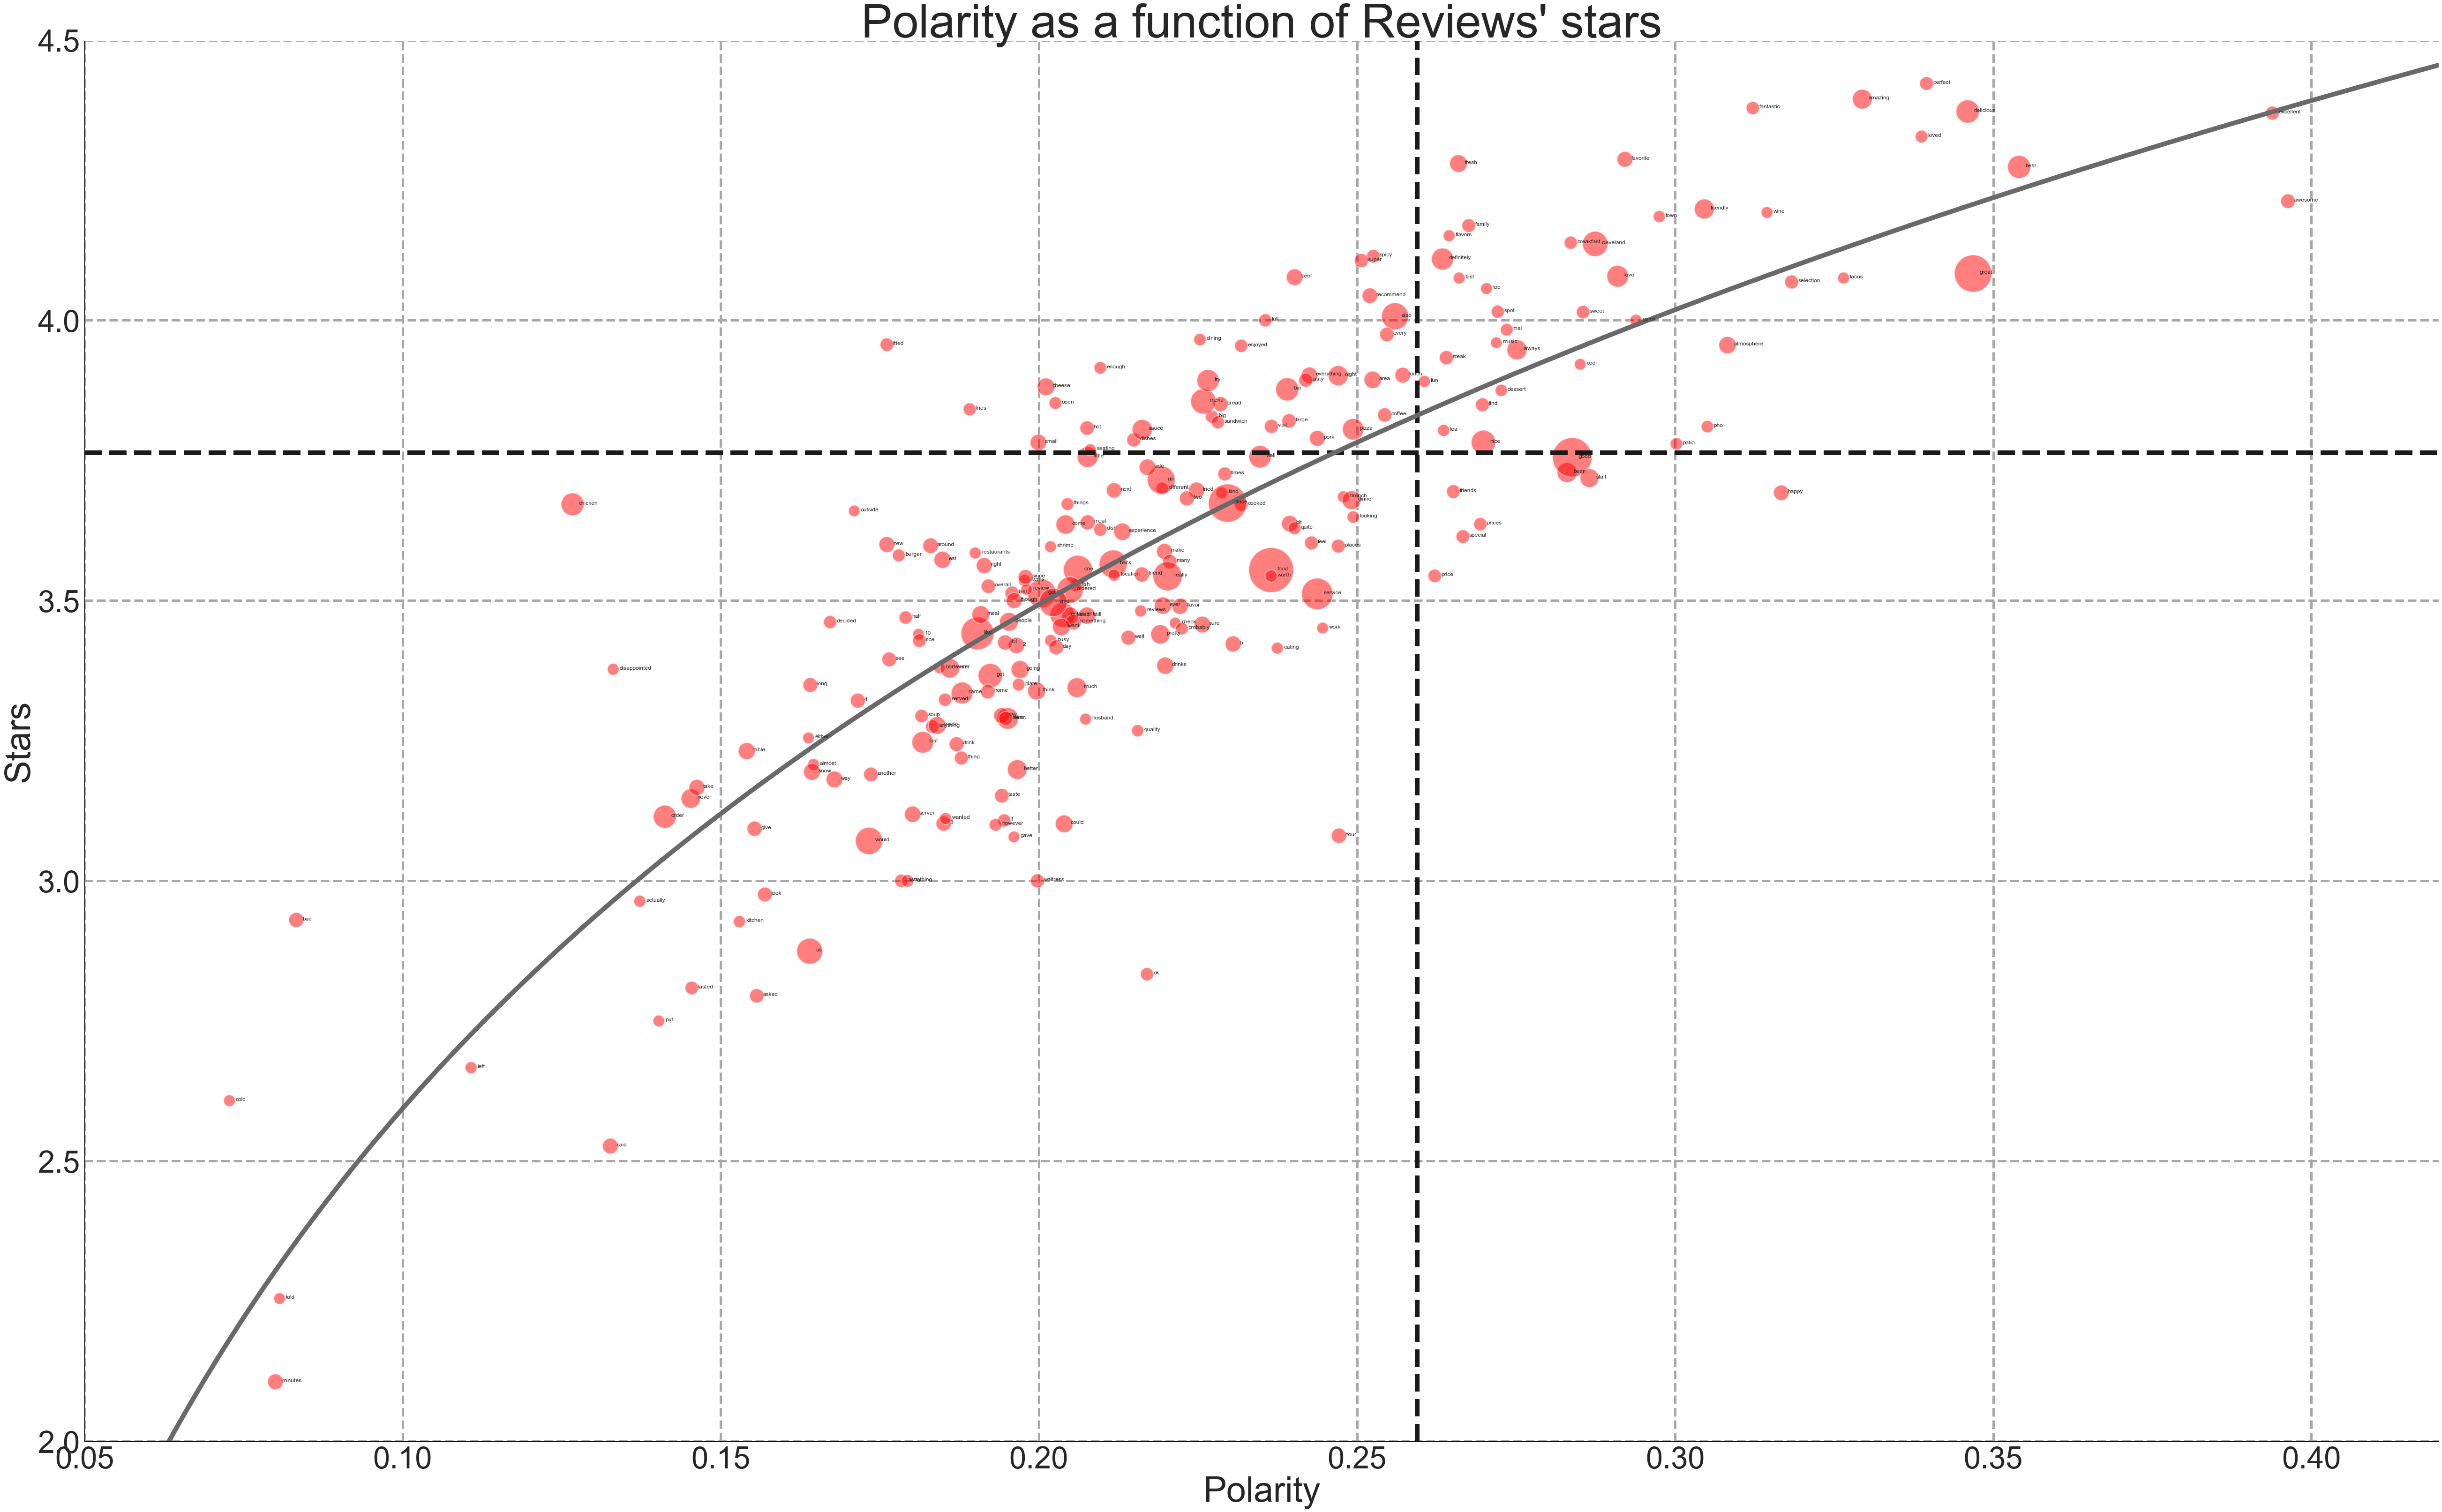
In this part, we'll explore the importance and frequency of individual words in Yelp reviews. We will identify the most common reviews and then plot the average polarity vs the user stars for the reviews where those words occur.
review_clv_1000 = review_clv.sample(n = 1000,random_state=1)

def reshape_data(review_subset):
    """
    Reshape the input dataframe of review data.
    """
    from pandas import Series, merge

    X = (review_subset['formatted_text']
         .apply(Series)
         .stack()
         .reset_index(level=1, drop=True)
         .to_frame('word'))


    R = review_subset[['polarity', 'stars', 'review_id']]

    return merge(R, X, left_index=True, right_index=True).reset_index(drop=True)

review_clv_1000_2 = review_clv_1000
review_clv_1000_2_reshape = reshape_data(review_clv_1000_2)

review_clv_1000_2_reshape_text =review_clv_1000_2_reshape
review_clv_1000_2_reshape_text['count'] = 1

size = review_clv_1000_2_reshape_text.groupby(["word"],as_index=False)['count'].sum()
avg_stars =  review_clv_1000_2_reshape_text.groupby(["word"],as_index=False)['stars'].mean()
avg_polarity =  review_clv_1000_2_reshape_text.groupby(["word"],as_index=False)['polarity'].mean()
summary = pd.merge(size, avg_stars, on="word")
summary = pd.merge(summary, avg_polarity, on="word")
filtered=summary.loc[(summary["count"]>=50)]
filtered
mean_polarity=review_clv['polarity'].mean()
mean_stars=review_clv['stars'].mean()
print("\n","Mean Polarity",mean_polarity,"\n","Mean Stars",mean_stars)

# Plot Scatter
fig, ax = plt.subplots(figsize=(90,55))
size_scatter=12*filtered['count']
plt.scatter('polarity', 'stars', s=size_scatter,
            data=filtered,color="red", alpha=0.5,
           edgecolors="white", linewidth=2)
plt.xlim(0.05, 0.42)
plt.ylim(2, 4.5)
plt.grid(color='#A8A8A8', lw=5,linestyle='dashed')

# Plot Text
for a in range(len(filtered)):
    ax.text(x=filtered.iloc[a,3]+0.001,y=filtered.iloc[a,2],s=filtered.iloc[a,0])

# Setting
ax.axvline(x=mean_polarity, c='k', lw=10,linestyle='dashed')
ax.axhline(y=mean_stars, c='k', lw=10,linestyle='dashed')
ax.set_xlabel("Polarity", fontsize=75)
ax.set_ylabel("Stars", fontsize=75);
ax.set_title("Polarity as a function of Reviews' stars", fontsize=100);
ax.tick_params(axis='both', which='major', labelsize=65)
ax.spines["left"].set_color("black")
ax.spines["bottom"].set_color("black")

# Regression Line
linear_regressor = LinearRegression()
polarity=filtered['polarity'].values
stars=filtered['stars'].values
polarity=polarity.reshape(-1,1)
linear_regressor = LinearRegression()
linear_regressor.fit(np.log(polarity), stars)
x_pred = np.log(np.linspace(0.05, 0.42, num=200).reshape(-1, 1))
y_pred = linear_regressor.predict(x_pred)
ax.plot(np.exp(x_pred), y_pred, color="#696969", lw=10)


plt.rcParams['axes.facecolor'] = 'white'
plt.show()

3 Correlating restaurant data and household income
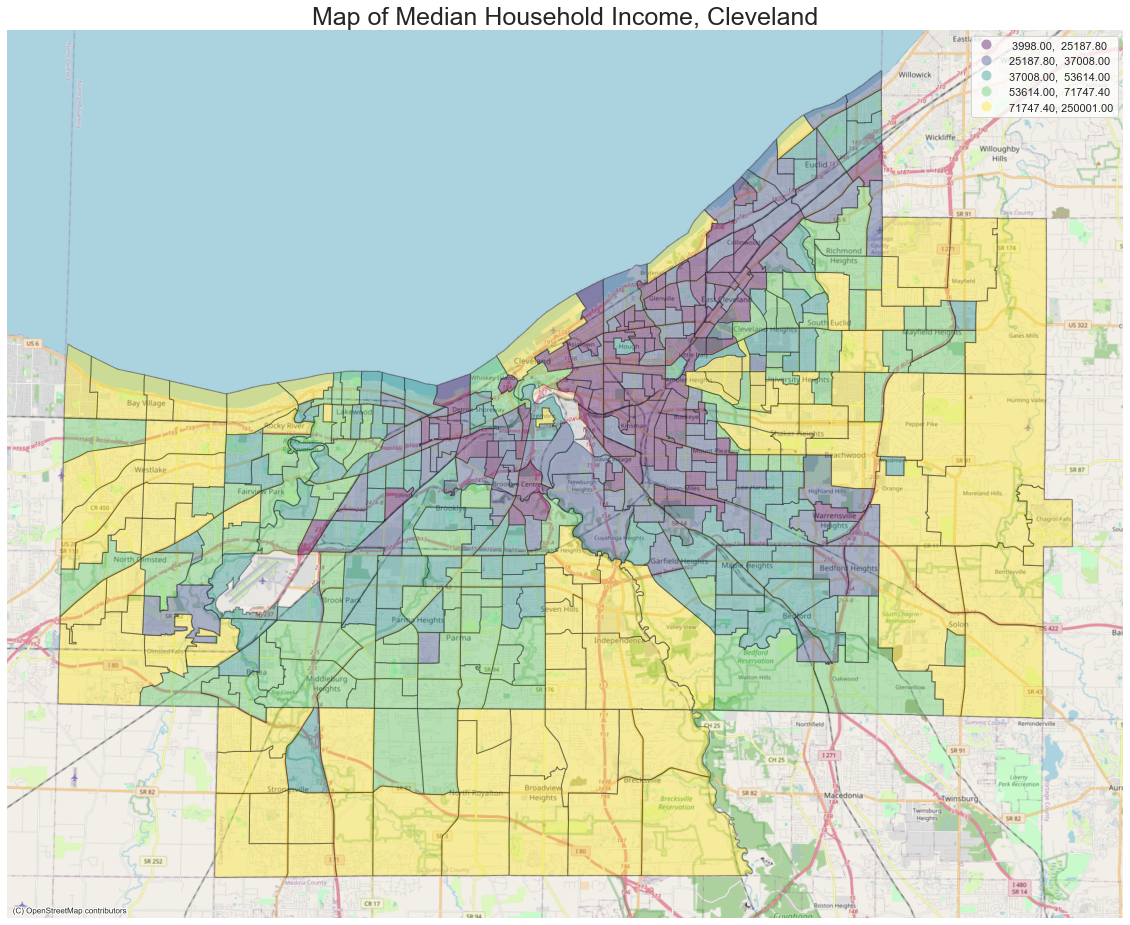
In this part, we'll use the census API to download household income data and overlay restaurant locations.
acs = cenpy.remote.APIConnection("ACSDT5Y2018")

clv_MedHHInc_tract = acs.query(
    cols=["NAME", "B19013_001E"],
    geo_unit="tract:*",
    geo_filter={
                "state" : "39",
                "county" : "035"
               },
).rename(columns={"B19013_001E": "MedHHInc"}, errors="raise")

acs.set_mapservice("tigerWMS_ACS2018")
where_clause = "STATE = 39 AND COUNTY = 035"
clv_tracts = acs.mapservice.layers[8].query(where=where_clause)

clv_MMedHHInc_M = clv_tracts.merge(
    clv_MedHHInc_tract,
    left_on=["STATE", "COUNTY", "TRACT"],
    right_on=["state", "county", "tract"],
).loc[:, ['geometry', 'NAME_y', 'MedHHInc','state','county','tract']].to_crs(epsg=32617)

clv_MMedHHInc_M=clv_MMedHHInc_M.rename(columns={"NAME_y": "NAME"}, errors="raise")

clv_MMedHHInc_M['MedHHInc'] = clv_MMedHHInc_M['MedHHInc'].astype(float).round()

clv_MMedHHInc_M = clv_MMedHHInc_M[clv_MMedHHInc_M['MedHHInc']>0]

fig, ax = plt.subplots(figsize=(20,20))
clv_MMedHHInc_M.plot(
    ax=ax,
    column='MedHHInc',
    legend=True,
    cmap='viridis',
    scheme='quantiles',
    alpha=0.4,
    edgecolor='k'
)

cx.add_basemap(ax,zoom=12, crs=clv_MMedHHInc_M.crs, source=cx.providers.OpenStreetMap.Mapnik)
ax.set_axis_off()
ax.set_title("Map of Median Household Income, Cleveland", fontsize=25);

3.2 Overlay the restaurants data
In this section, we will overlay the restaurants and color the points according to the 'stars' column.
clv_res=pd.read_json("./data/restaurants_cleveland.json.gz",orient="records",lines=True)

clv_res['geometry'] = gpd.points_from_xy(clv_res['longitude'], clv_res['latitude'])
clv_res = gpd.GeoDataFrame(clv_res, geometry='geometry', crs="EPSG:4326")
clv_res=clv_res.to_crs(epsg=32617)

Income = clv_MMedHHInc_M.hvplot(c='MedHHInc',
                      frame_width=780,
                      frame_height=600,
                      crs=32617,
                      cmap='viridis',
                      alpha=0.7,
                      dynamic=False)

Restaurant = clv_res.hvplot(
                      frame_width=780,
                      frame_height=600,
                      crs=32617,
                      c="stars",
                      hover_cols=['name','stars'],
                      alpha=0.9,
                      dynamic=False).options(cmap=["#FFEE00","#F55368"])

combination3 = gvts.Wikipedia * Income * Restaurant

combination3.opts(
    opts.WMTS(width=780, height=600, xaxis=None, yaxis=None),
    opts.Overlay(title="Map of Restaurant and Median Household Income"))
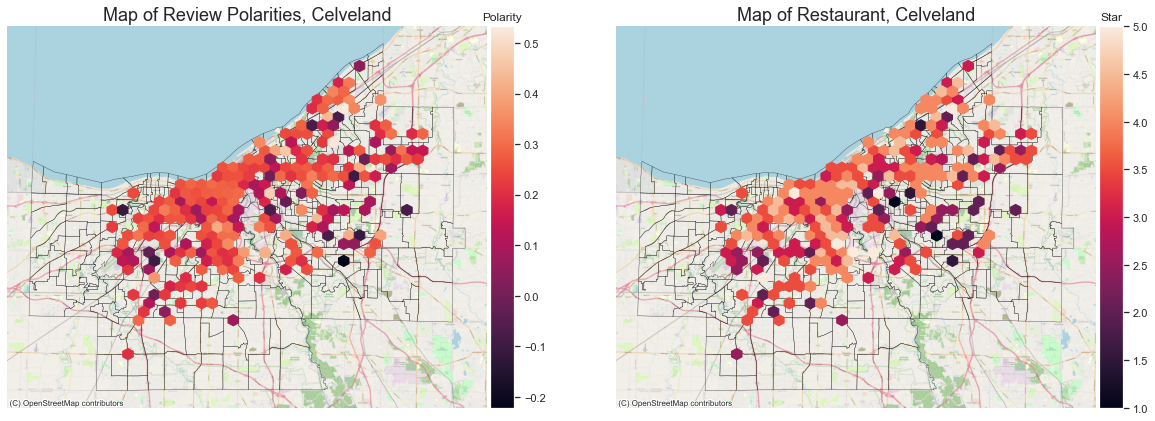
3.3 Comparing polarity vs. stars geographically
review_clv_2 = review_clv.loc[:,["business_id","polarity"]]
mergedf = pd.merge(clv_res, review_clv_2, on="business_id")
# Set canvas
fig, axs = plt.subplots(ncols=2,figsize=(20,10))
ax1=axs[0]
ax2=axs[1]

# hexbin coordinate
xcoords = mergedf.geometry.x
ycoords = mergedf.geometry.y
polarity = mergedf.polarity

# Tract plot
clv_MMedHHInc_M.plot(ax=ax1,facecolor="none", edgecolor="black", linewidth=0.25)
clv_MMedHHInc_M.plot(ax=ax2,facecolor="none", edgecolor="black", linewidth=0.25)

# Hexbin plot
hex_vals1 = ax1.hexbin(
    xcoords,
    ycoords,
    gridsize=30,
    C=mergedf.polarity,
    reduce_C_function=np.median)

hex_vals2 = ax2.hexbin(
    xcoords,
    ycoords,
    gridsize=30,
    C=mergedf.stars,
    reduce_C_function=np.median)

ax1.set_title("Map of Review Polarities, Celveland", fontsize=18);
ax2.set_title("Map of Restaurant, Celveland", fontsize=18);

ax1.set_axis_off()
ax2.set_axis_off()

# Color bar
divider1 = make_axes_locatable(ax1)
cax1 = divider1.append_axes('right', size='5%', pad=0.05)
colorbar_polarity=fig.colorbar(hex_vals1, cax=cax1, orientation='vertical')

divider2 = make_axes_locatable(ax2)
cax2 = divider2.append_axes('right', size='5%', pad=0.05)
colorbar_stars=fig.colorbar(hex_vals2, cax=cax2, orientation='vertical')

colorbar_polarity.ax.set_title('Polarity')
colorbar_stars.ax.set_title('Star')

# Basemap plot
cx.add_basemap(ax1,zoom=13, crs=clv_MMedHHInc_M.crs, source=cx.providers.OpenStreetMap.Mapnik)
cx.add_basemap(ax2,zoom=13, crs=clv_MMedHHInc_M.crs, source=cx.providers.OpenStreetMap.Mapnik)
