Real Estate Transfers

Xiong Zheng


Data Resource

The Department of Records (DOR) published data for all documents recorded since December 06, 1999, including all real estate transfers in Philadelphia. Document type, grantor, and grantee information is presented by address for each transaction. More specifically, the real estate transfers data shows the dates and location of property sales, deeds, mortgages, and sheriff deeds, and includes associated data, such as any realty transfer tax paid.

1 Data Wrangling

In [29]:
import dask.dataframe as dd
import pandas as pd
import datashader as ds
import datashader.transfer_functions as tf
import matplotlib.pyplot as plt
import numpy as np
from datashader.utils import lnglat_to_meters
from colorcet import fire
from datetime import datetime
import imageio

RETransfers = dd.read_csv("rtt_summary_all.csv", assume_missing=True,dtype={'address_low_frac': 'object',
       'address_low_suffix': 'object',
       'condo_name': 'object',
       'discrepancy': 'object',
       'document_date': 'object',
       'legal_remarks': 'object',
       'matched_regmap': 'object',
       'receipt_date': 'object',
       'receipt_num': 'object',
       'reg_map_id': 'object',
       'street_address': 'object',
       'street_name': 'object',
       'street_postdir': 'object',
       'street_predir': 'object',
       'street_suffix': 'object',
       'unit_num': 'object'})
columns = ['objectid','display_date','lat','lng']
RETransfers = RETransfers[columns].dropna()

x, y = lnglat_to_meters(RETransfers['lat'], RETransfers['lng'])
RETransfers['x'] = x
RETransfers['y'] = y

RETransfers['display_date'] = RETransfers['display_date'].str.split(' ')
RETransfers['display_date'] = RETransfers['display_date'].str.get(0)

RETransfers['display_date'] = RETransfers['display_date'].map_partitions(pd.to_datetime,format='%Y/%m/%d',meta = ('datetime64[ns]'))
RETransfers['month'] = RETransfers['display_date'].dt.month
RETransfers['year'] = RETransfers['display_date'].dt.year

RETransfers_drop = RETransfers.drop('display_date',axis=1)
2 Single Image Attempt

In [58]:
PhillyBounds = [( -75.28,  -74.96), (39.86, 40.14)]
x_range, y_range = lnglat_to_meters(PhillyBounds[0], PhillyBounds[1])
x_range = list(x_range)
y_range = list(y_range)

# Plot
cvs = ds.Canvas(plot_width=600, plot_height=600, x_range=x_range, y_range=y_range)
agg = cvs.points(RETransfers_drop, "x", "y", agg=ds.count())
img = tf.shade(agg, cmap=fire, how="eq_hist")
img = tf.set_background(img, "black")
img

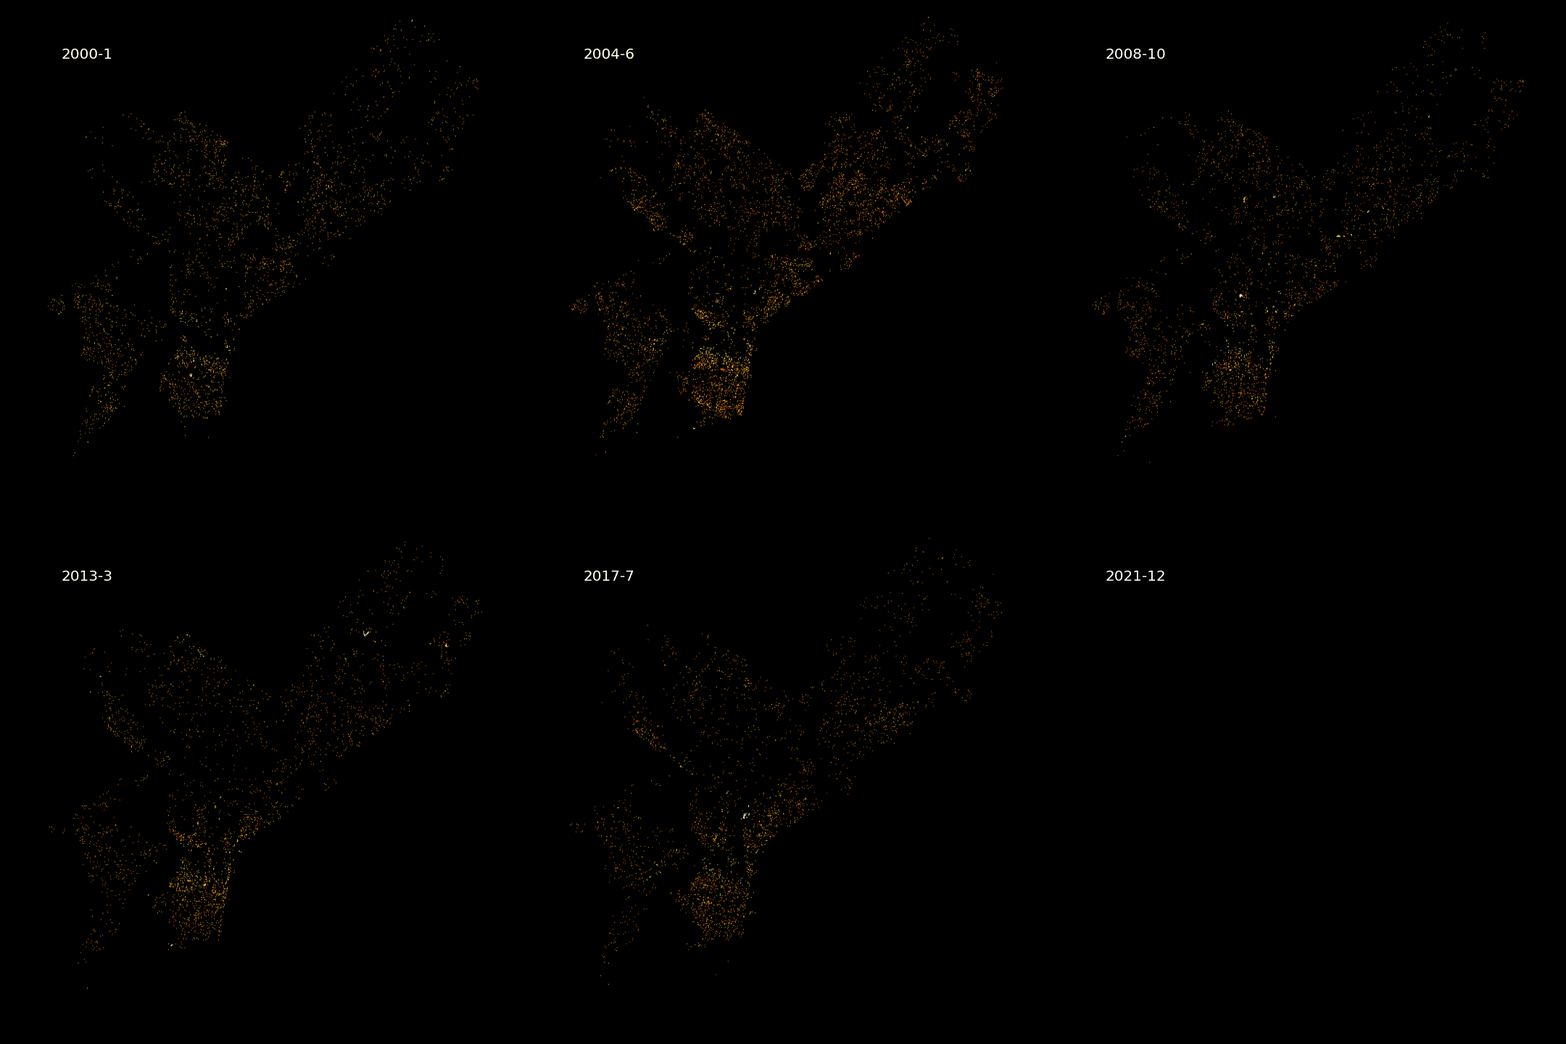
3 Animation

In [59]:
plot_width  = int(900)
plot_height = int(plot_width*7.0/12)

def create_image(df, x_range, y_range, w=plot_width, h=plot_height, cmap=fire):
    cvs = ds.Canvas(plot_width=w, plot_height=h, x_range=x_range, y_range=y_range)
    agg = cvs.points(df, 'x', 'y',  ds.count())
    img = tf.shade(agg, cmap=cmap, how='eq_hist')
    img = tf.set_background(img, "black")
    return img.to_pil()

def plot_count_by_yearmonth(fig, data_all_months, years,months, x_range, y_range): 
    df_this_month = data_all_months.loc[(data_all_months["year"] == years)]
    df_this_month = df_this_month.loc[(data_all_months["month"] == months)]
    img = create_image(df_this_month, x_range, y_range)
    plt.clf()
    ax = fig.gca()
    ax.imshow(img, extent=[x_range[0], x_range[1], y_range[0], y_range[1]])
    ax.set_aspect("equal")
    ax.set_axis_off()
    fig.subplots_adjust(left=0, right=1, top=1, bottom=0)
    fig.tight_layout()
    time = "%s" % (year)+"-"+"%s" % (month)
    ax.text(
        0.05,
        0.9,
        time,
        color="white",
        fontsize=20,
        ha="left",
        transform=ax.transAxes,
    )
    fig.canvas.draw()
    image = np.frombuffer(fig.canvas.tostring_rgb(), dtype="uint8")
    image = image.reshape(fig.canvas.get_width_height()[::-1] + (3,))

    return image

fig, ax = plt.subplots(figsize=(10,10), facecolor='black')

imgs = []
yearrange=range(2000,2022)
monthrange=range(1,13)
for year in yearrange:
    for month in monthrange:
        print(year,month)
        img = plot_count_by_yearmonth(fig, RETransfers_drop,year,month, x_range=x_range, y_range=y_range)
        imgs.append(img)
    
imageio.mimsave('assignment5.gif', imgs, fps=1);
drawing